Blake Morrow’s Chart of The Day – Mar 25th 2021


IWM
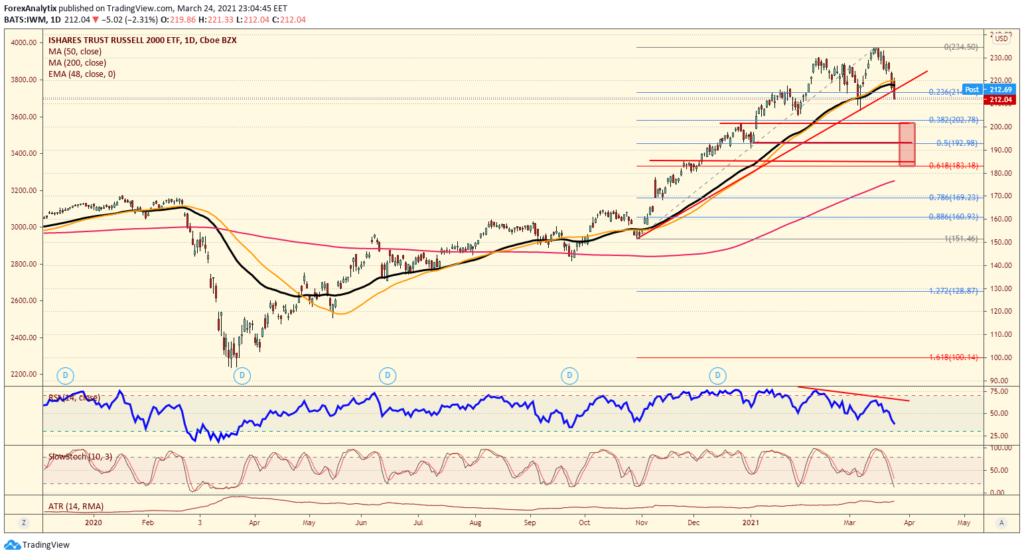
One of our traders in the Forex Analytix chatroom (Jayne) pointed out at the end of the session that the Russell 2000 (IWM) has broken its ascending trend line. With that, I wanted to point out a few other things that is important to this chart as well. First, the last rally into new all time highs in mid March was also with a divergent RSI which was warning of a failed rally attempt. Second, breaking the ascending trend line should put a 38% – 61.8% Fibonacci retracement in view for some near term support. This could be from 200 all the way towards the 183.00 level near term. The 200dma is rising daily and should be near the 61.8% retracement upon reaching there if ultimately that is where we are going in the coming week(s).