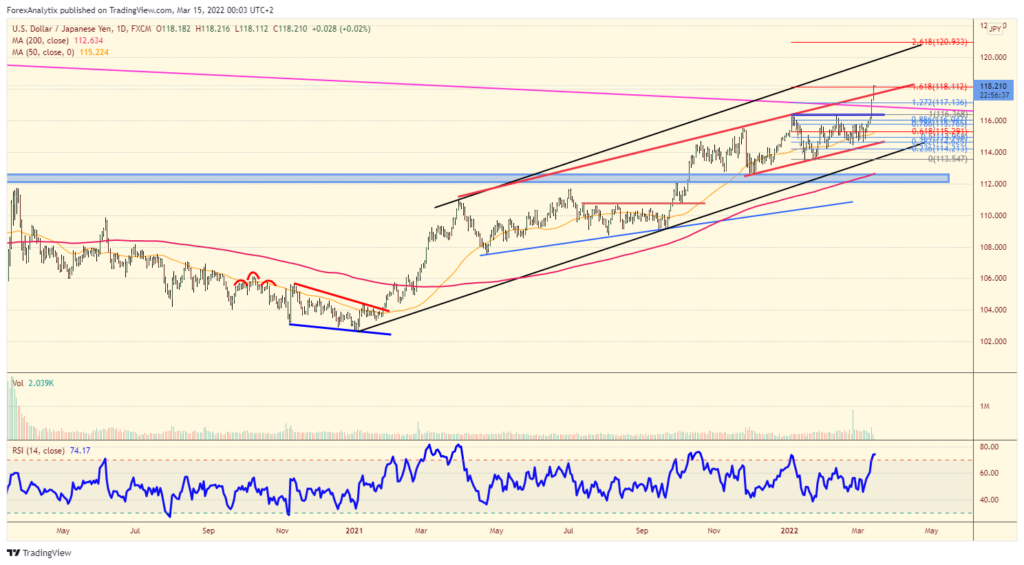
Blake Morrow’s Chart of The Day – Forecast USD JPY

Forecast USD JPY
The #USDJPY has had a relentless bid the last few months, even as some US equities have slumped (which is not a ‘normal’ JPY correlation). The pair finally broke the 116.35 horizontal resistance and that has capped the pair the last couple months and has now broken higher, clearing a trend line which has been in existence since 1990. Near term, the daily chart is overbought via the RSI, now traders will be looking for dips to the 117.00 and 117.65 for dips to be long with a possible resistance at the 119.65 and 120.00.
One of the other things to note is the 10yr bond market has hit a new trend low and the rally in yields is providing a tailwind for the pair. If you want to learn about the “Trader Funding Program” click here.

20220315


