Blake Morrow’s Chart of The Day – Apr 1st 2021


USDJPY
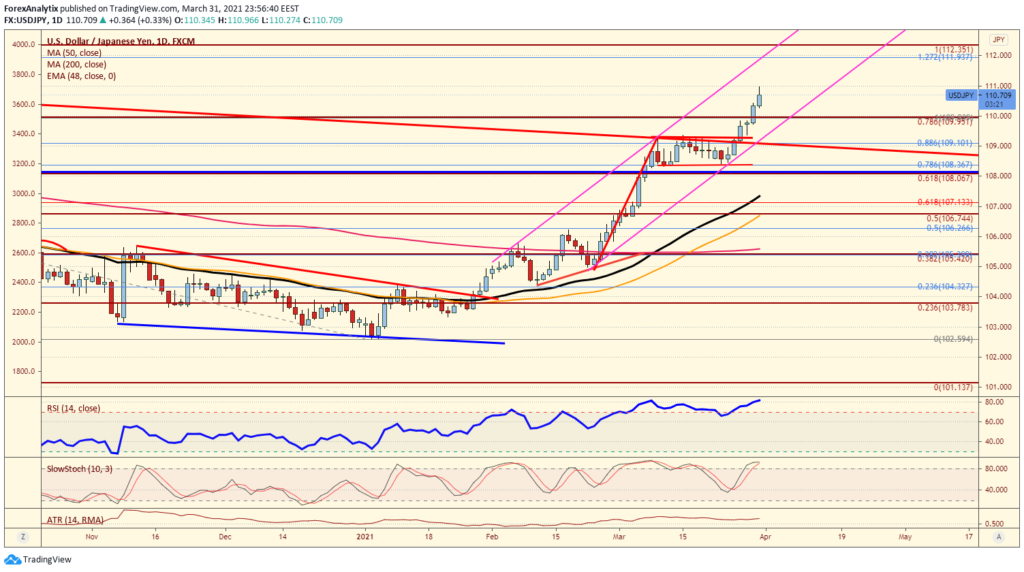
Two weeks ago we warned that this trend would be strong for our “Chart of the Day” on March 15th, and now that the USDJPY is breaking the multi-year trend line, it is time to revisit where we can go next. The overbought RSI didn’t matter too much, and probably doesn’t now either. It could pause the trend, but ultimately while we are above the 109.30 level the risk is for a test of the channel at 112.00 which is also a 127% extension of the June 2020 highs to January 2021 lows this year may be upon us. Also, the market is closely watching the 10yr yields for clues, which we feel this correlation should stay strong near term as well.