Blake Morrow’s Chart of The Day – Mar 9th 2021


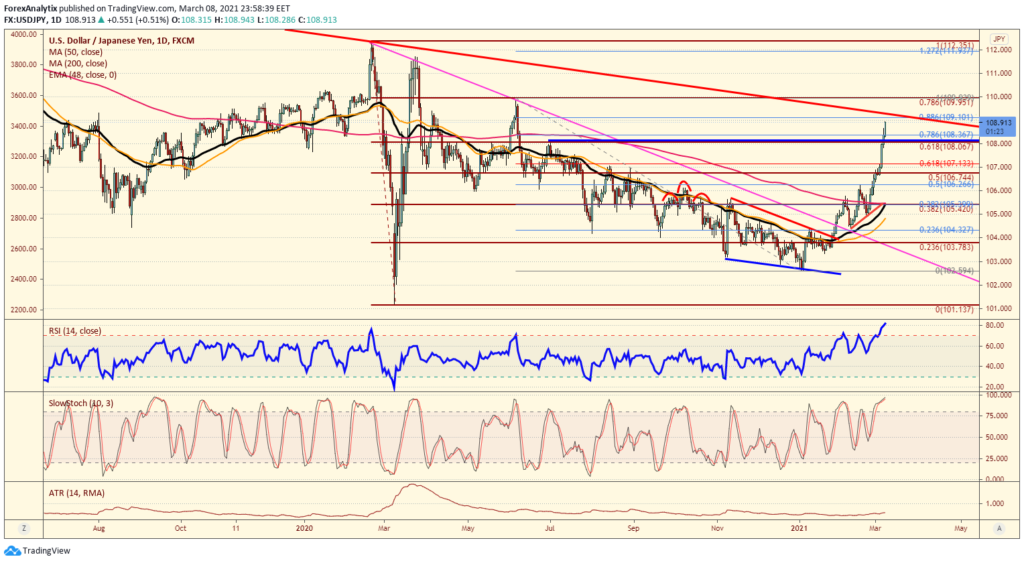
USDJPY
The USDJPY is nearing a multi year trend line form the highs in 2015 to the 109.10/20 level which is near the 88% Fibonacci retracement of the June 2020 high to the January 2021 low. Daily RRI is overbought but we must note that the daily RSI was much higher in 2014 and also 2016, so don’t let the overbought current RSI readings fool you. It will be important to see how the USDJPY reacts above the 109.00 level especially as it is tracking the global bond market yields higher as well.