AUD/JPY in Focus as it Hovers Near the Key 85 Level


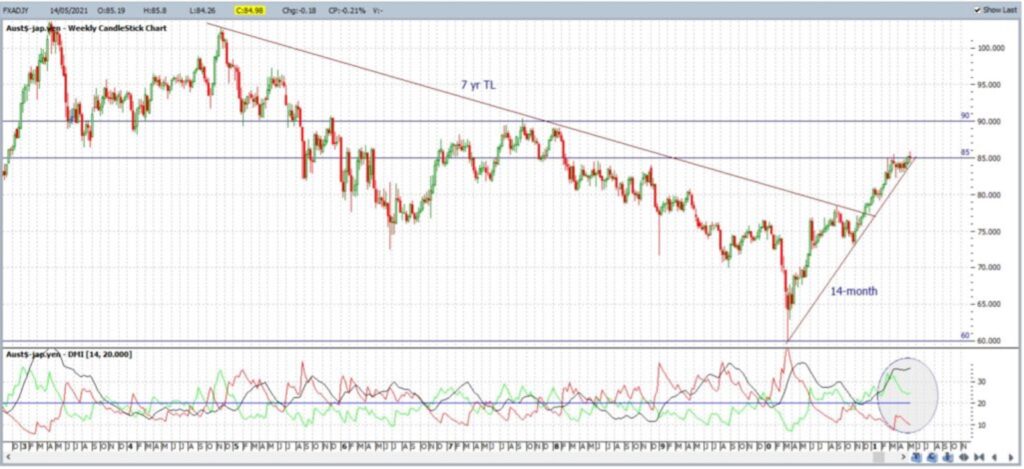
The AUD/JPY closed with a bearish-coloured Spinning Top weekly candle, reflecting indecision, but recovered the week to close back above the key 85 level. The previous week’s close above 85 was rather significant as it was the first weekly close above this resistance level since early February 2018!
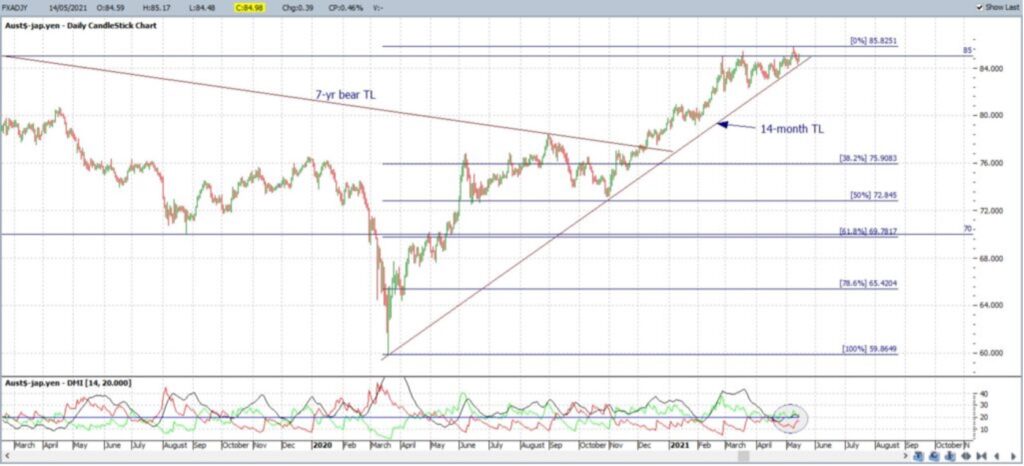
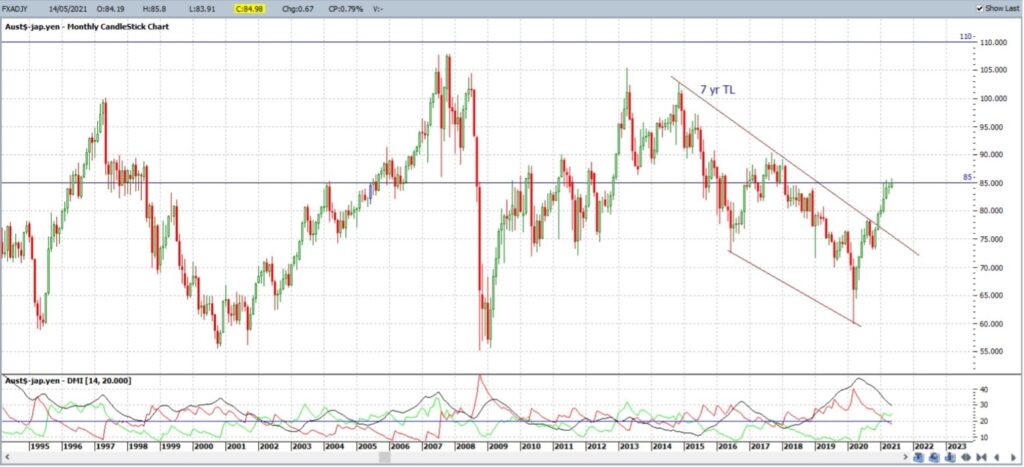
The weekly and monthly charts reveal that the 85 level has been a significant reaction zone for the AUD/JPY over many decades and has been considerable resistance for the last three years; this level was peppered many times throughout 2018 but could not be broken.
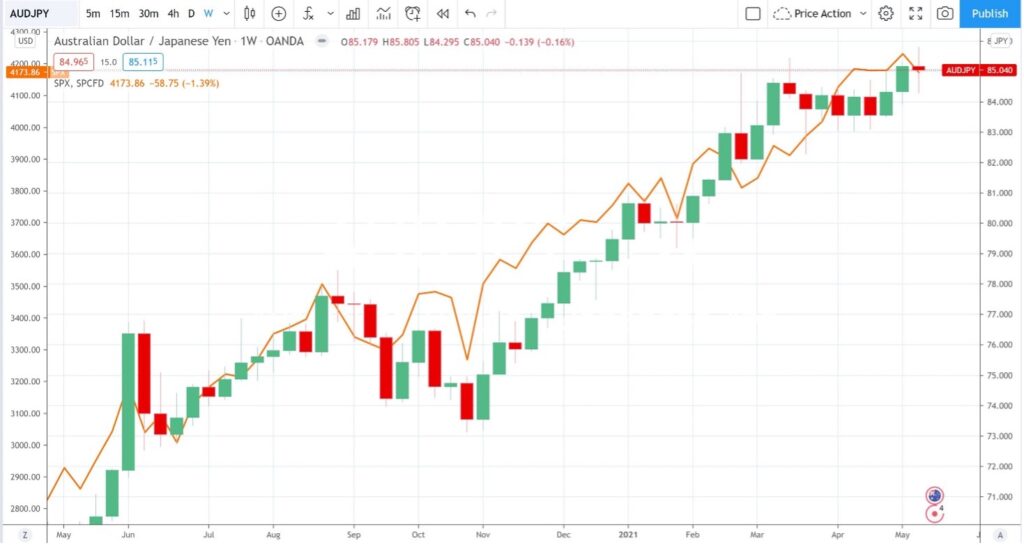
This second, consecutive weekly close above 85 is a rather bullish signal but will no doubt be in greater focus with traders given the recent bearish shift with US stock sentiment. The S&P500 index and AUD/JPY are generally highly positively correlated, as the chart below reveals, so any pause or serious pullback with US stocks might render a similar bearish pathway for the AUD/JPY. Alternatively, any bullish continuation with stocks could help the AUD/JPY to extend above 85.
AUD/JPY versus S&P500 (gold line) weekly: a high degree of positive correlation:
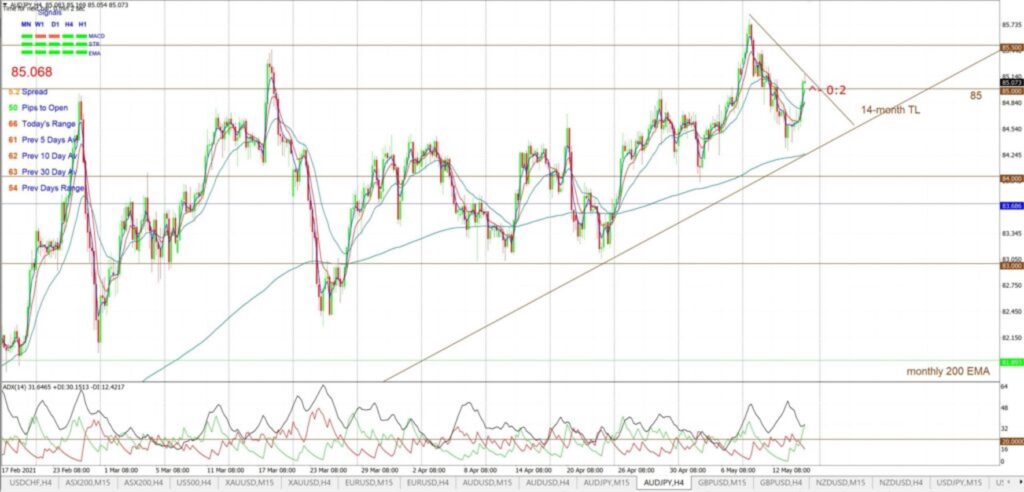
There are revised 4hr chart trend lines to monitor for any new AUD/JPY breakout. Keep in mind, though, if stock sentiment continues to sour then the 85 level could be a pivotal one to monitor for any new weakness with the AUD/JPY.
Bullish targets: Any bullish 4hr chart triangle breakout would bring 85.50 into focus followed by whole numbers on the way up to 90 S/R (the next major resistance level as seen on the weekly and monthly charts).
Bearish targets: Any bearish retreat below 85 would bring the 14-month support trend line into focus. After that, watch whole-numbers on the way down to 76 as this is still near the recently broken 7-yr bear trend line, and then 70 as this is near the 61.8% Fibonacci of the March 2020 – March 2021 swing High move.
- * Watch 85 and for any new 4hr chart triangle breakout:
Mary McNamara