All-time High Close Occurs on Negative Breadth & 3 Sectors Down 1%


Monday Technical Video 6/14, discussing SPX, Nat Gas, Gold
Replay Link- Thursday Technical Webinar 6/10- “Strategies to Benefit from Uptick in Volatility”
Replay Link- Thursday Technical Webinar 6/3- “10 charts to watch for the Month of June”
CNBC 6/2 Interview-WTI CRUDE and Energy
SPY – (3-5 Days)- Cautiously Bullish into FOMC- Expect rally up to 426-8, but feel its right to pare down longs by end of week. Cycles show weakness in late June and expect a downturn begins within 3 weeks. Skeptical that 430 is hit before selloff. Demark Exhaustion could be complete by Wed.
FEZ (3-5 Days)- Bullish- Tomorrow-Thursday could be important for FEZ, and prices have now reached 61.8% Fib retracement of ’07-09 decline. Use strength over next couple days to Sell into before stallout/reversal
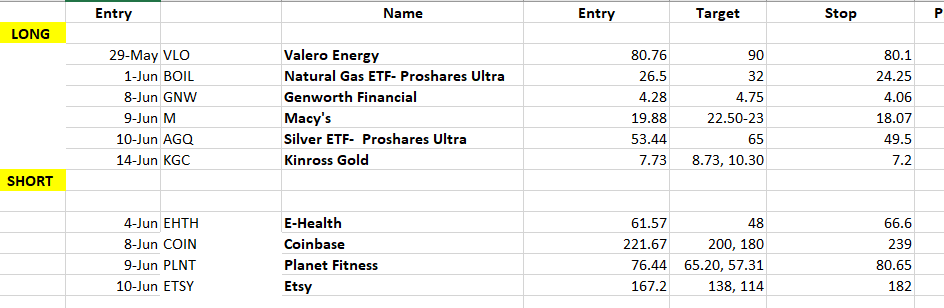
Technical Long/Short Focus list 6/15/21- Stops on closing basis only
Key Technical developments worth highlighting:
1) Nasdaq 100 joined SPX at new all-time highs, though NASDAQ Composite diverged negatively as did DJIA which has fallen for 6 straight days while DJ Transports has fallen 9 of the last 11
2) Treasury yields backed up Monday, though still some doubt that a low in yields is here given how sharply yields have fallen in recent weeks. It’s thought that a rally back to recent highs in yields is possible, but for now, still looks early
3) Healthcare , Energy and REITS remain leaders and have recently hit all-tim highs in June. However, the other 8 sectors out of 11 peaked out between March and May. Thus, important to pay attention on what’s carrying indexes
4) Commodities have diverged of late, with Lumber falling sharply and Grains rolling over in recent days. Natural Gas, Sugar, cotton, coffee look bullish and Precious metals consolidation should be buyable into FOMC
5) Demark indicators require 4-6 trading days on QQQ while SPY will trigger a perfected TD Combo sell by Tuesday or Wednesday of this week. I expect continued divergences and different indices might peak out at different times this month
6) US Dollar looks to be on the verge of breaking down, and expect an upcoming test of January 2021 lows.
7) Mid-caps (MDY) and Small-caps (IWM) both remain under March/April highs and have not pushed up to new all-time highs
8) Cycles show evidence of peaking out and turning down into late June into July. Expect this happens between FOMC meeting and early next week
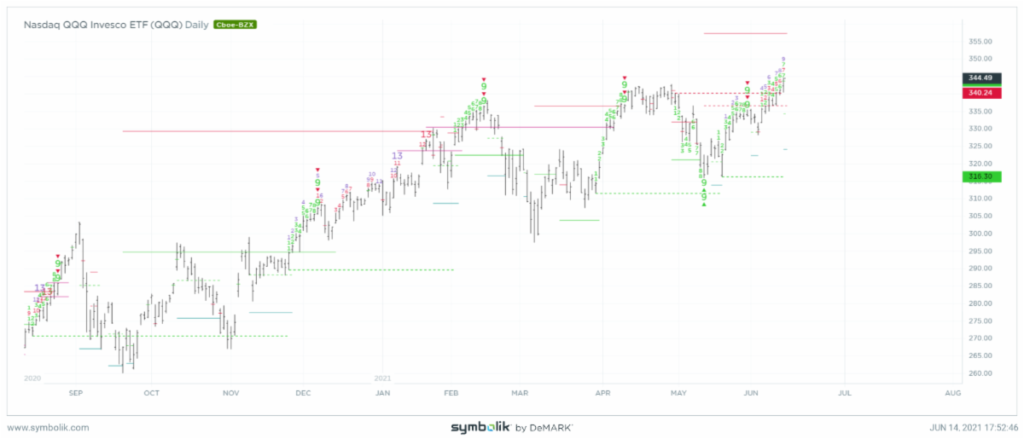
QQQ breakout accomplished Monday, though NASDAQ Composite, DJIA lags- Demark exhaustion lines up 4-6 days to sell- Monday’s gains back to new highs were certainly bullish for this week, and for most Technology stocks that rallied back, but yet we continue to see divergences between other indices and breadth was Negative Monday while more than half of all sectors were down. This directly shows the degree of Technology serving to camouflage the market’s progress lately as 3 key sectors fell 1% Monday. Bottom line, price is truly the key thing that matters, and this is positive and does suggest follow-through into FOMC. TD Sequential and TD Combo show 7 and 9 counts. Thus another 4-6 trading days are possible which would line up with a possible turn near the June Summer Solstice at end of week/next Monday. Resistance to sell/short QQQ lies at 355-8, and would take off any QQQ longs there and give serious consideration to a SQQQ (Short Nasdaq) Long on further strength into Friday.
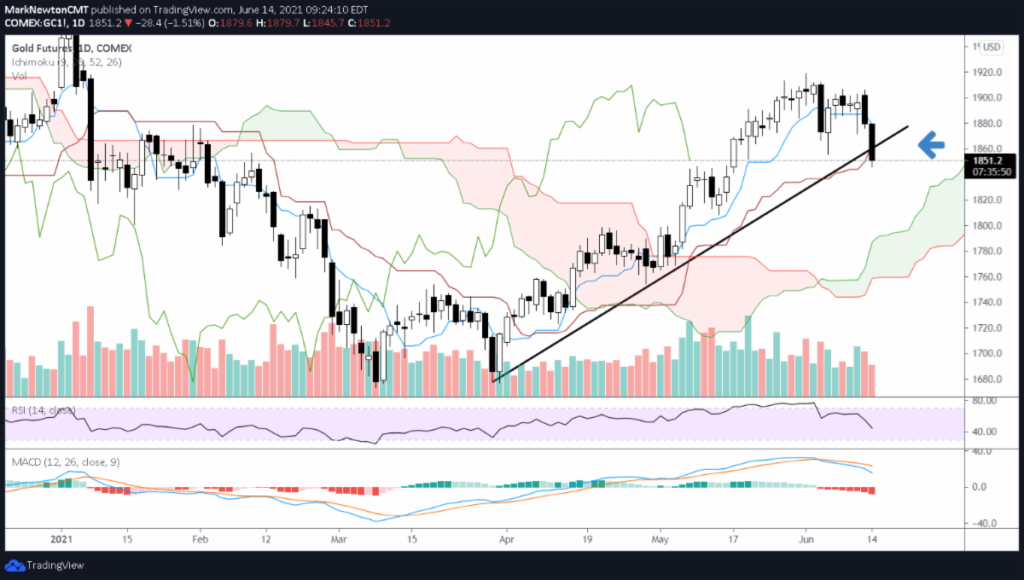
Precious metals are setting up to buy as of FOMC meeting this week. Both Gold and Silver fell in trading Monday though structurally this rise still looks to bottom out this week and turn back to new highs post FOMC. It’s right to consider buying Gold and Silver or consider some of the ETF’s which are based on both or the accompanying stocks which might correlate with either. Technically i do not give the trendline break Monday much credence given the pattern of the most recent drawdown, and this is something to buy into (Most Ellioticians might label this a “Double ZigZag” pattern)
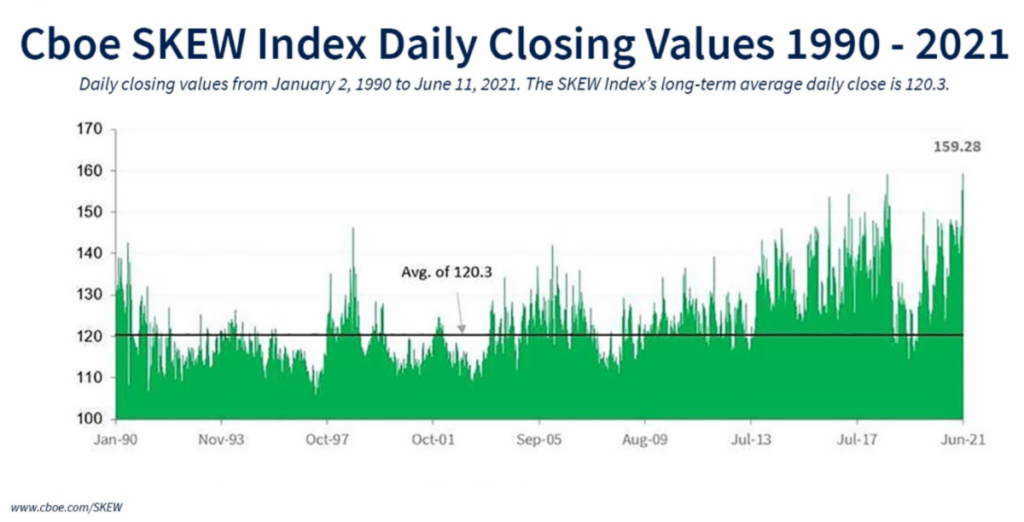
The CBOE SKEW index is now back at new all-time highs, which i feel will prove to be accurate this time around in suggesting volatility is right around the corner. Created in 1990, this measures the difference in price volatility for Calls vs Puts, and when elevated, it shows that investors are hedging for market risk over the next 30-day period. It doesn’t always signal concern as the 3 month forward return after 2016 and 2017 both were positive. However, it did appear shortly ahead of the Flash Crash in 2010 and at 2011 peaks, not to mention prior to the late 2015 decline into early 2016 and also prior to last year’s stunning 33% decline in 33 calendar days (Hit all-time highs back in December 2019) Overall, its not always right to view this hedging which would drive the cost of puts higher relative to calls as negative, but also not always positive either from a contrarian standpoint, as it’s had its fair degree of success over the years. It does suggest that we should be very selective in what to buy heading into the back half of June into July at a minimum, and consider keeping stops tight on longs.
Mark Newton
Managing Member/Founder
ML Newton Advisors LLC
You can reach me at: https://newtonadvisor.com/
Or email me at info@newtonadvisor.com for copies of recent notes, or to inquire about how my work might fit to one’s investment process.